In IELTS Writing Task 1 Academic, you have to describe a graph or chart, a map or room layout, or a process. Your written work has to be at least 150 words long. You have about 20 minutes to complete the task. Here you will find useful phrases, techniques, tips, and examples of IELTS Academic Writing Task 1.
This page is about IELTS Writing Task 1 Academic. For IELTS Writing Task 1 General click here.
Contents
1. Line Graph
– Line Graph Description Example
– Description Vocabulary
2. Chart (Bar chart/pie chart)
– Bar Chart Description Example
3. IELTS Writing Task 1 Vocabulary
4. Process Description
– Process description example
5. IELTS Writing Task 1 Assessment criteria
6. Extra Tips
This task is intended to check your ability to see main trends and provide a description of the data you are given, to compare it with other information, to highlight changes, or to describe a process. All in all, there are four distinct types of tasks:
- Line graph requires you to describe changes in the graph over a period of time.
- Bar chart and pie chart tasks are about comparing numbers that you are given.
- Process description involves describing the sequence of stages involved in a process.
- Map and room layout description – features and objects’ relative positions and respective changes over time.
Line Graph
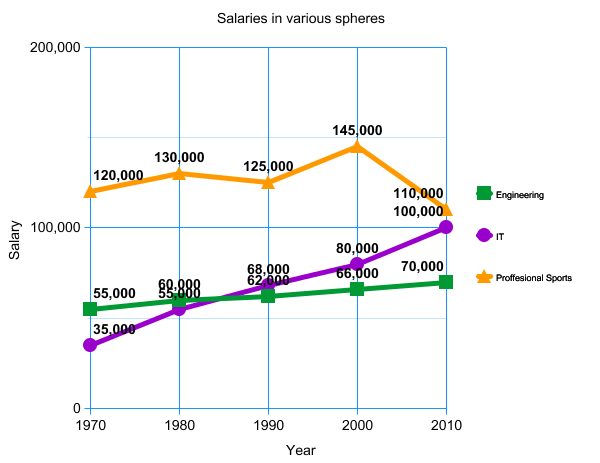
The graph shows the change in average salaries across various spheres of employment in the US over a period of 40 years.
Summarise the information by selecting and reporting the main features and making comparisons.
NB: The numbers I have used here are fictional and in no way reflect the actual salaries in their respective industries. Do your own research if you are interested in real salary figures.
We will be using this graph to go over the basics of the IELTS Line Graph. The process of describing bar charts, pie charts, and tables isn’t much different.
Understanding the main idea
First and foremost, you have to get the main idea of the graph.
Try to understand the key features of the graph. What does it show? What numbers are the biggest? Are there any trends?
You are encouraged to use your pen to circle and underline the main features of the graph.
Ideally, you should find one dominant trend and one or two secondary trends (if there are any).
General tips on describing a graph
- Do not try to analyse or explain everything in the graph.
- Try to establish the main trend or trends.
- Group the data.
Study the graph above. Print it, and don’t hesitate to make notes on it. Circle the important parts: how trends begin and end, sudden changes, low and high points, differences between trends, and differences over periods of time.
The graph shows salary dynamics in various spheres over a period of 40 years.
Here are the main ideas that we can point out:
- Salaries in IT and engineering have been increasing.
- Salaries in IT have displayed most prominent rise over the whole period.
- Despite fluctuation, salaries in sports have been higher than in the other two spheres.
- Salaries in sports witnessed a sharp decline in the year 2000.
Once you have established the main trends, it is time to group them. Grouping information makes it easier to structure logically as well as read. An example of grouping data can be seen in the sample writing below.
IELTS Writing Task 1 Vocabulary
As you are going to be describing certain changes and processes, you will need to use vocabulary that denotes those changes. In order to avoid word repetition, it is a good idea to memorise as many such words and phrases as you can.
| Verbs of movement, up (preposition) – usage Climbed (to) – neutral Went up (by) – neutral Increased (to/by/-fold1) – neutral Rose (to/by) – neutral Skyrocketed (to) – strong, inf. Gained (no preposition) – neutral Recovered (to) – after a previous fall Shot up (no preposition) – strong, inf. Surged (no preposition) – strong | Verbs of movement, down (preposition) – usage Fell (by/to) – neutral Dwindled (by/to) – neutral Subside (to) – neutral Declined (by/to) – neutral Pitched (at) – neutral Decreased (by/to) – neutral Dropped (by/to) – strong Sank (to) – strong Plummeted (no preposition) – strong Collapsed (no preposition) – strong |
| No change in the graph Remained constant/unchanged/stable etc. Levelled out (at) Evened out (at) Stabilised (at) | Tops and Bottoms Peaked (at) Reached a peak (of) Topped (at) Bottomed (at) Reached the bottom (at) |
| Verbs: Indicating Show Display Demonstrate Experience (as in “to go through”) Boast (about high figures) | Synonyms for “number” Mark Level Volume High/low (to reach a new high/low) Point |
| Examples: words and prepositions From 1990 to 2000 Over the next decade Went up/down by a quarter Increased twofold Reduced to 100,000 During the next twenty years Over the whole period in the graph | Adverbs and intensifiers Slightly (weak) Gradually (weak) Marginally (weak) Considerably (strong) Dramatically (strong) Drastically (strong) Sharply (strong) Steeply (strong) Abruptly (strong) |
1. Twofold – twice, threefold – three times; and so on
Remember: reusing the same expressions over and over again will reduce your lexical resource mark.
Now we will use these words and expressions to describe our line graph.
IELTS Line Graph Description Example
The graph presents the changes in the amount of money people were earning in three different industries over the period of 1970 to 2010.
The industries of IT and engineering both displayed gradual increases over the whole graph period. While engineers’ salary growth was marginal, going from 55 to 70 thousand over the course of 40 years, the paycheck of IT workers showed a much more pronounced increase, going from 35 to 100 thousand in the same period. Both industries experienced no downward movement in their salary figures.
The area of professional sports showed a slight fluctuation in numbers during the period from 1970 to 2000. Despite that, it still remained the highest-paying occupation throughout the whole graph, with a peak salary of 145 thousand in the year 2000. Over the next decade the numbers sank, reaching the 110 thousand mark.
In conclusion, the IT industry showed the fastest-growing salary figures, and engineering had the slowest change in pay. Despite the sports salary decline in 2000, it still remained the best paid occupation of the three.
(171 words)
I want you to pay attention to the words in bold. They are examples of synonym usage to get a higher lexical resource score (show-display-experience-present; numbers-figures-mark; industry-job-occupation). Underlined fragments are examples of words and phrases from the graph vocabulary table.
When writing your introductory paragraph, you may be tempted to simply copy the task description. Don’t – the copied part will not count towards your total number of words. Instead, paraphrase the task.
Original: The graph below shows the change in median salaries in various spheres of employment in the US over a period of 40 years
Paraphrased: The graph presents the changes in the amount of money people were earning in three different industries…
IT and engineering are grouped and described in the first body paragraph because they display similar dynamics. As it was said before, you only have to mention graph features that stand out the most: minimums and maximums, turning points and pattern deviations.
Paragraph two is dedicated to sports careers because the chart behaves in a different way and the salaries are considerably higher there despite the end-graph plunge. Both the plunge and the fluctuation are worth noting in your writing, although this doesn’t mean that you have to put down the number for every fluctuation swing.
Your conclusion can be a brief comparison or an overview of the salary dynamics. Again, it’s worth grouping industries with similar figures, as I did. Try to make your summary at least two sentences long, though it can be quite difficult to come up with a relevant follow-up sentence. If you find yourself at a loss for the second sentence, just paraphrase the introduction and add a generalising statement that refers to the graph.
Chart Comparison
This task focuses on juxtaposing or comparing the chart data. The main difference between a line graph and a chart comparison is that there is no dynamic in the latter. Instead, you match different numbers against each other. These numbers can represent many things — city population, prices, market shares, and so on.
Below is the task that we will use as an example (a bar chart):
You should spend about 20 minutes on this task.
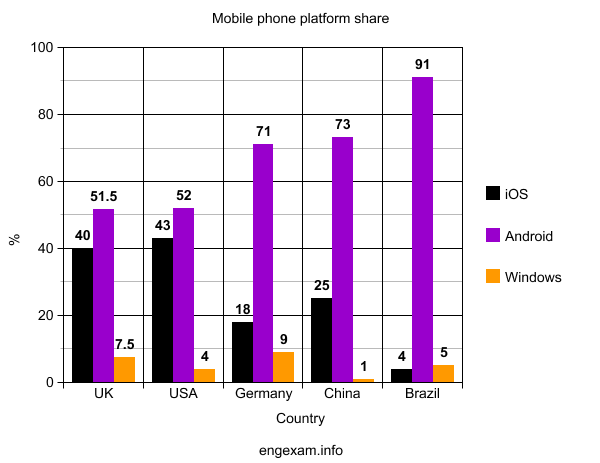
The chart below shows the market share of mobile phones in each country in 2015.
Summarise the information by selecting and reporting the main features and making comparisons.
In order to keep your writing under 150 words, you have to group data. The data presented in this chart could be grouped in two different ways:
- By country (UK and USA have pretty similar statistics, Germany and China are alike too)
- By platform (iOS, Android and Windows)
For this particular chart, I would recommend the second option. The reason for this is that grouping by country would be difficult; the data in this graph is very diverse. Grouping by platform is easier, as the trends are more obvious.
Grouping by platform will require three body paragraphs, one for each brand. The order of paragraphs should relate to the importance of their respective brands. As Android’s presence is the largest, it makes sense to dedicate first paragraph to its data. Then come iOS and Windows in the second and third paragraphs, respectively.
Choosing to have three body paragraphs means that our description has to be very brief. Make sure you read about keeping your narrative concise.
IELTS Bar Chart Description Example
The chart described below shows the mobile phone market situation around the world. The data is structured to indicate the share of all three major mobile platforms in each country mentioned .
Android devices are dominant in all the countries presented, reaching the highest mark of 91% in Brazil. Mobile devices of this brand constitute more than half of the total market share, with the lowest figure of 51.5% in the UK.
Mobile devices based on iOS are the second most popular, with the highest presence figures in the US and the UK at 43% and 40% respectively. The lowest mark for iOS-based devices is registered in Brazil, where it gets as low as 4%, outperformed by the third most popular brand – Windows.
Windows-operated gadgets are the least widespread, with a mere 9% of the market in Germany, 7.5% in the UK, and only 1% in China.
Overall, the market is divided unevenly among the brands, with Android towering over the other two brands. Even though iOS-based units have a substantial presence in some countries, they are dwarfed by the leader’s figures. Windows platform numbers are far lower than those of its competitors.
(172 words)
In this text, I went slightly over the word limit. You are not penalised for that. However, keep in mind that more words mean more time spent on the text and more potential mistakes in it.
What you should be worried about is falling short of the 150 mark; texts that are seriously underlength (less than 145 words — a rough but sensible estimate, not the official figure) get a reduced score. If you struggle to reach the 150 mark, then you are doing something wrong, either missing a trend or not giving enough information about the graph. Usually, keeping it under 150 is the real challenge, which, however, can be made much easier by writing in a more concise manner.
Process Description
In IELTS Writing Task 1: Process Description, you write about a process that can be shown in the form of either a flowchart or picture. This task focuses on your ability to group smaller stages and to describe their sequence, or how they go one after another.
We shall use the task below for illustration.
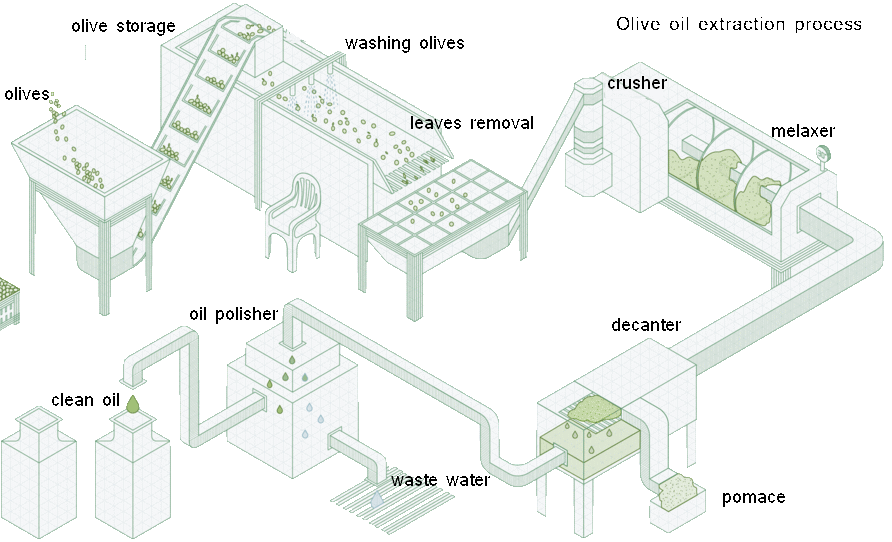
The picture below illustrates how olive oil is made.
Write a report for your tutor describing the production process.
Links for bigger pictures: 1280px, 2980px
There are several challenges that set this type of IELTS Writing Task from others. As you will be describing processes — shown as a diagram or a flowchart — you will have to deal with the following difficulties:
- Grouping the process stages. It is necessary that you group your information; this will allow for easier paragraphing and make your text more readable. There should be at least two stages; three is the optimum figure. We will look into this in the example task below.
- Sequencing – tenses and vocabulary. Any process involves several things that happen one after another. To get more points for grammar and vocabulary, it is important to use various ways of expressing this order of actions. See the article about tenses for more information.
- Description vocabulary. To describe a process, you have to know what certain involved components are called and what they do. Again, look at the example task below for clarification.
Looking at the example task, we can divide the process into three larger stages: preparation, processing, and refining. If you want, you can combine the two last stages into one.
Unlike other IELTS Writing Task 1 tasks, this one doesn’t require a separate paragraph for the conclusion. Your writing ends with the last stage of the process description. Nevertheless, you are still required to write an introductory paragraph that briefly states the topic and purpose of your writing.
As you will be writing to your tutor, your style should be strictly formal. Do not use any contracted forms, informal expressions. Refer to the list of formal and informal language for further reference.
IELTS Process Description Example
The production of olive oil can be divided into three major stages. The first stage is cleaning and preparing the olives. Stages two and three process and refine the product, respectively.
During the first stage, the olives are poured into a funnel that sends them on the escalator, lifting the fruit to the washing machine. These get washed and then, with the help of the moving band, transported to the leaf separation device.
Ready-to-use olives are then pushed into the crusher, turning them into pulp, which is mixed by the melaxer right after. The resulting substance is then sent to decanter, where the pulp is filtered and turned into liquid. At the same time, the residual pomace is produced during the filtering.
The final stage is refining the resulting liquid. Said liquid is poured into the oil polisher, where water and oil are separated. The water is discarded into sewage, while the clean oil is put in containers.
(159 words)
In this text, I went with the three body paragraph structure because of the three distinct stages that comprise the process.
The introduction clearly stated that by naming all three stages. It is good practice to make your reader aware of what the text is about before he continues to the body paragraphs.
Now look at the marked words. Underlined parts of the text are verbs that describe transitions or changes that take place during the course of the process. Do not resort to a couple of verbs like “it goes to” and “it moves”. In this particular text, pay attention to the use of passive tense. Olives do not move by themselves; they are moved.
Words in bold are used for sequencing — order of things that take place in the picture. There aren’t that many synonyms for such words, so whenever possible, you should try to omit them, using the context as an indicator of what happens after what. Take a look at the first body paragraph. No sequence words were used there, but the order of stages is clear from the context.
IELTS Writing Assessment criteria
1.Task achievement
Task one, Academic: How logically and clearly you group and present the trends, stages or differences in the task material; how clearly and appropriately you illustrate all of the points required by the task.
Task two: How fully address the ideas mentioned in the task; how well you develop your position on the question; how appropriately you use points and ideas to support your opinion and their relevance to the task.
2. Coherence and cohesion
Task one and two: How clearly and logically you sequence (organize) your essay; how diversely and appropriately you use cohesive devices; how you use paragraphing to structure your essay.
3. Lexical resource
Task one and two: How varied and flexible your vocabulary is; How precise and accurate your word choice is, including such aspects as word register and style; How good your spelling and word-formation skills are.
4. Grammatical range and accuracy
Task one and two: How diverse your choice of various grammatical structures is and how appropriately you use them.
IELTS Writing Task 1: Don’t do this
- Don’t try to analyze the figures in the graph. You are not required to share your vision for the trends and directions they take. Doing so won’t get you any points, but it will eat up the word limit. All you have to do is describe what is going on in a clear, easy-to-understand manner. Your opinion can be voiced later in Writing Task 2.
- Don’t try writing a draft version of your essay first. You won’t have time to write both the draft and the fair copy. Instead, you simply go through your essay after you have finished writing it and correct all the mistakes or imperfections you find. You will not be penalized for self-correcting as long as it is easy to make out what you have written or corrected.
- Don’t write more than you should. As it was mentioned above, more writing means more mistakes that are likely to pop up. Unless you really have to, refrain from going over the set word limit of 150 words in Task 1 and 250 words in Task 2.
- Don’t waste your time counting your words. A better way to do that is to count how many words you have in one line and then multiply it by the number of lines. It will give you a rough but reliable number.
- Don’t be biased towards the information in the graph. That includes both the personal attitude mentioned above and a reasonable distribution of text space. Body paragraphs should be of fairly equal size. Do not let one body paragraph overpower the others in volume.
IELTS Task 1 Writing Tips
- Pay attention to prepositions. There is a difference between “decreased by 50” and “decreased to 50”. In the first one, it went down by 50, so if it was 500 it became 450. In the second, one it became 50, no matter how big the original number was.
- To avoid repeating more colloquial expressions, refer to this list of synonyms for the most overused words.
- If you write about something that has no relation to the topic, it is possible that these words will not count towards your total number of words. Stay on topic!
- For more ideas about structuring your writing and other aspects of the written part of your English exam, see this article on essay writing.
 Click to download this IELTS Writing Task 1 Academic worksheet in PDF
*** Mobile devices of this brand constitute more than half of the total market share with the lowest figure of 51.5% in the UK. Not the US.
Thanks for pointing that out, I have corrected it accordingly